We have all our infrastructure on Rackspace. Rackspace had to reboot all the servers recently, so we decided to get some better monitoring going on our servers, e.g. are they up and are the services running on them up.
To do this, I created two small dashboards using Dashing.
The Dashing uses the rufus-scheduler to run jobs.
These jobs were simple to set up, just ping (via Net::Ping::TCP) each server, and return the response time.
To add some styling we decided on a “upper limit ping time”, so if servers were above this limit, they would show up as orange.
An erroneous ping would give back -1 and show up in red with blinking.
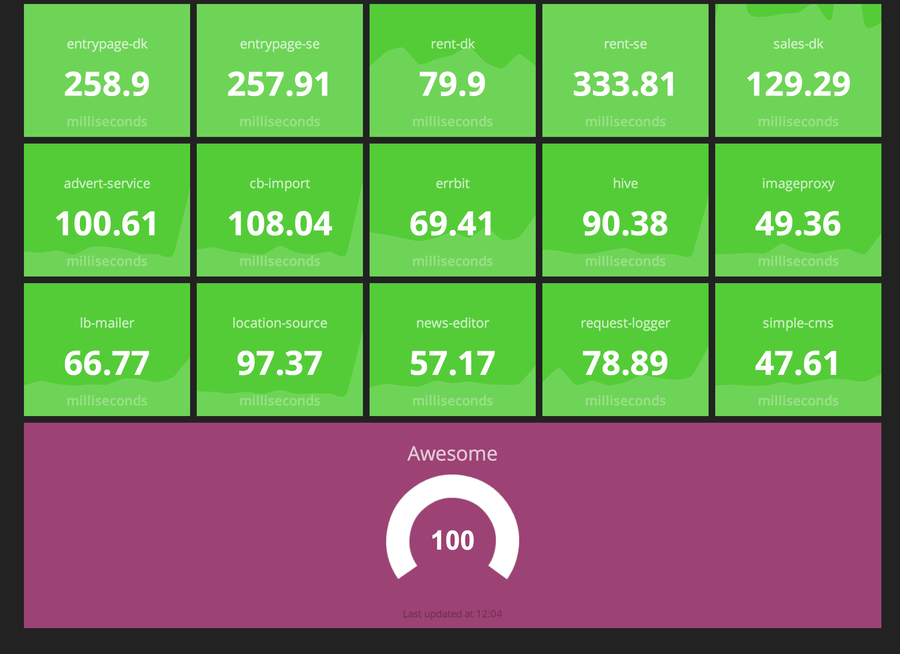
I then did the same for our services (running in Docker).
Each service has a health check endpoint, which I could just cUrl in job using curb.
This is the resulting dashboards:
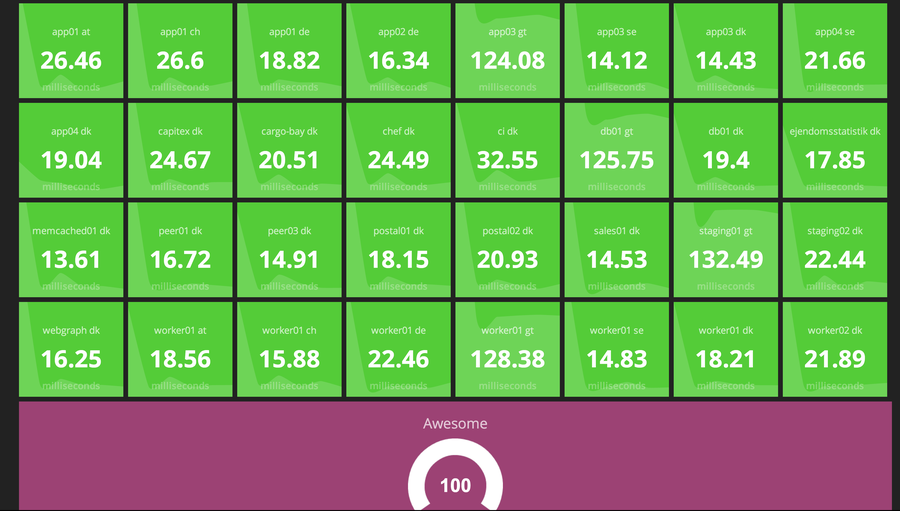
When trying to see if the servers could manage the reboots, we started rebooting the servers, and could watch these two dashboards if anything went wrong. It made it super easy to spot what was down and thereby where we had to do more.
Conclusion: Monitor Everything!